
What Is Maximum Adverse Excursion in Forex Trading?
Maximum Adverse Excursion (MAE) measures the worst price movement against your position before it closes. Every forex trade experiences temporary losses, but MAE captures exactly how far price moved against you at its peak. This metric helps traders understand the pain threshold their strategies must endure and reveals whether stop losses are placed too tight or too wide.
Unlike simple win/loss ratios, MAE shows the internal journey of each trade. A winning trade might have experienced significant adverse movement before recovering, while a losing trade might have moved against you immediately. Professional traders use MAE to separate strategies that recover from drawdowns versus those that fail consistently.
Understanding Maximum Adverse Excursion
MAE represents the maximum loss that occurred during an open trade, measured from the entry price to the worst point reached before closing. If you enter a long position at 1.1000 and price drops to 1.0950 before eventually closing at 1.1020, your MAE is 50 pips — even though the trade finished profitable.
This metric differs from traditional drawdown because it focuses on individual trades rather than account equity. Standard drawdown tracks your overall account balance decline from peak to trough, while MAE examines the adverse price movement within each specific position. This granular view helps identify which trading setups consistently face large adverse moves and which remain stable.
Professional traders prioritize MAE tracking because it reveals the true risk exposure of their strategies. A system might show profitable results on paper, but if every winning trade requires surviving a 200-pip adverse movement, the strategy carries hidden risk. MAE data exposes these vulnerabilities before they cause significant account damage.
How to Calculate Maximum Adverse Excursion
Calculating MAE requires tracking the lowest equity point during each trade's lifetime. Start by recording your entry price, then monitor the worst price level reached against your position. For long trades, this is the lowest price before closing. For short trades, it is the highest price reached.
The formula is straightforward:
- Long trades: MAE = Entry Price − Worst Price
- Short trades: MAE = Worst Price − Entry Price
Convert this to a monetary value by factoring in position size and the instrument's point value. A long EUR/USD trade entered at 1.1000 with a worst price of 1.0970 on a standard lot produces an MAE of 30 pips, or approximately $300.
Essential data points include entry price, worst adverse price during the trade, position size, and trade duration. Some traders track MAE in pips for consistency across different instruments, while others prefer dollar terms for portfolio-level analysis. Both methods provide valuable insights when applied consistently.
The challenge is capturing the worst price accurately. Standard MT4 and MT5 trade reports only show entry and exit prices — they don't record the worst point reached during the trade's lifetime. Minute-level price reconstruction using candle data is needed to derive true MAE. Tools like PortQuant perform this reconstruction automatically, walking through every minute candle during each trade's life to capture the precise worst-case adverse excursion.
MAE vs Maximum Favorable Excursion (MFE)
While MAE tracks the worst price movement against your position, Maximum Favorable Excursion (MFE) measures the best price movement in your favor before the trade closed. MFE captures how far price moved toward profit at its peak during the trade's lifetime.
MAE focuses on risk — how much pain your strategy must tolerate. MFE focuses on opportunity — how much profit potential was available before you exited. A trade with high MFE but mediocre final profit suggests you are exiting too early. High MAE with eventual losses indicates stop losses might be too wide.
Exit Efficiency
The ratio between your actual profit and MFE reveals your exit efficiency — the percentage of available profit you actually captured:
Exit Efficiency = (Net Profit ÷ MFE) × 100
An exit efficiency of 70% means you typically capture 70% of the best available price before closing. Below 50% suggests your exits are consistently leaving money on the table. Above 80% indicates well-timed exits — though this is difficult to maintain consistently.
Using MAE and MFE Together
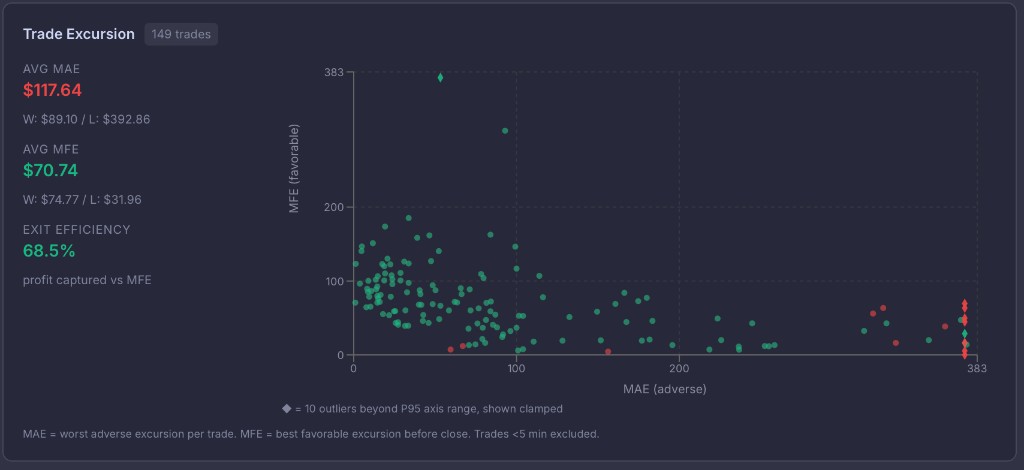
Plotting MAE against MFE for all trades on a scatter chart reveals powerful patterns:
- Low MAE, high MFE (top-left quadrant): Strong entries — price moved in your favor without much adverse excursion. These are your ideal trade setups.
- High MAE, low MFE (bottom-right): Poor entries — price moved heavily against you and never recovered meaningfully. These setups need refinement or elimination.
- Low MAE, low MFE (bottom-left): Small, contained trades — low risk but low reward.
- High MAE, high MFE (top-right): Volatile trades — high risk and high reward. These need careful position sizing.
Winning trades should cluster with low MAE and high MFE. If your winning trades show the same MAE distribution as your losing trades, your entry method lacks edge — it's not distinguishing between good and bad setups.
Practical Applications in Risk Management
Optimizing Stop Loss Placement
MAE analysis reveals optimal stop loss distances by showing where losing trades typically fail versus where winning trades temporarily dip. If your data shows winning trades average 40-pip MAE while losing trades immediately move 60+ pips against you, placing stops at 50 pips creates a logical threshold.
Too-tight stops get hit by normal market noise, turning potential winners into realized losses. Too-wide stops allow catastrophic losses that destroy accounts. MAE data provides objective guidance by showing actual historical adverse movement patterns.
Review MAE statistics separately for winning and losing trades. If winning trades show consistent MAE ranges while losing trades show erratic patterns, your strategy has predictive value. If both categories show similar MAE distributions, your entry method needs refinement before adjusting stop losses.
Position Sizing Based on MAE Patterns
Adjusting position sizes according to historical MAE ranges protects your account from outsized risk. If your strategy shows maximum MAE typically reaches 2.5% of entry price, position sizing should ensure this translates to acceptable account risk. A trader with 2% account risk tolerance should size positions so the expected worst-case MAE equals 2% of account equity.
High-volatility pairs with larger MAE patterns require smaller position sizes. Lower-volatility setups with contained MAE allow larger positions while maintaining consistent account risk.
MAE percentiles provide additional refinement. Instead of planning for average MAE, use the 75th or 90th percentile to account for occasional larger adverse moves. This conservative approach prevents the surprise drawdowns that occur when trades experience worse-than-average adverse excursion.
MAE in MT4 and MT5 Platforms
MT4 and MT5 platforms provide basic trade history showing entry price, exit price, and final profit or loss. However, these platforms do not natively track the worst price reached during each trade's lifetime. Traders must manually review charts or use custom indicators to reconstruct MAE data — impractical for analyzing hundreds of trades.
The limitation is fundamental: standard platform reports only record two price points per trade (entry and exit), while MAE requires tracking the full price path between them. Two trades might show identical profit/loss figures, but one survived a 200-pip adverse move while the other never faced more than 30 pips against it. Without MAE tracking, these critical risk differences remain hidden.
PortQuant's Portfolio Engineering tools reconstruct the full minute-by-minute equity path for every trade using M1 candle data. This captures the precise worst-case adverse excursion (MAE) and best favorable excursion (MFE) for each position, revealing patterns that balance-based reporting misses completely.
Identifying Strategy Quality Through MAE Patterns
Recognizing when trades recover from adverse excursions separates robust strategies from fragile ones. A scalping system with average MAE of 10 pips and average profit of 15 pips demonstrates consistency. If the same system occasionally produces 50-pip MAE before recovery, those outlier trades signal entry timing issues.
Distinguishing between acceptable MAE and system failures requires statistical analysis. Calculate MAE standard deviation across all trades. Trades exceeding two standard deviations from mean MAE might indicate execution problems, news events, or market conditions unsuited to your strategy. Where MAE measures how far price moved against an open trade, slippage measures whether you got the fill price you asked for in the first place — a separate, often-ignored cost that PortQuant's Execution Quality view breaks down per strategy and per broker.
Consider a trend-following strategy that averages 80-pip MAE on winning trades and 120-pip MAE on losing trades. This 40-pip difference provides a decision point: if a trade reaches 100 pips adverse movement, statistical odds suggest it will likely become a loser. This insight allows you to exit manually before hitting your wider stop loss.
Common MAE Mistakes
Ignoring MAE in strategy development leads to blind spots about true risk exposure. Traders celebrate profitable months without realizing their system routinely faces 5% adverse excursions that could easily become 10% losses if market conditions shift.
Misinterpreting MAE without context causes flawed conclusions. A strategy showing 3% average MAE might seem risky, but for highly volatile emerging market currencies, 3% MAE might represent exceptional control. For major pairs, it might indicate poor entry timing. Always compare MAE relative to the instrument's typical volatility.
Reacting to individual trades rather than aggregate patterns. One trade experiencing unusual adverse movement might result from a news event or execution issue. Only when MAE consistently exceeds historical norms should you adjust stop losses or position sizes.
Advanced MAE Techniques
Portfolio-Level Excursion
Aggregating MAE across multiple positions reveals portfolio-level risk exposure that individual trade analysis misses. When correlated positions all face adverse movements simultaneously, the combined adverse excursion exceeds the sum of individual trade MAEs. This correlation risk becomes visible only through comprehensive tracking across all open positions.
Monte Carlo Simulation with MAE
Using MAE in Monte Carlo simulation helps stress-test trading strategies against extreme conditions. By simulating thousands of trade sequences using historical MAE distributions, you can model what happens when multiple trades hit maximum adverse excursion simultaneously. This analysis reveals whether your account can survive statistical edge cases that simple backtesting might not expose.
Volatility Regime Awareness
Correlating MAE with market volatility conditions provides regime-specific insights. Your strategy might show 1.5% average MAE during low-volatility periods but 4% during high-volatility environments. This knowledge allows you to adjust position sizing dynamically or avoid trading during unfavorable volatility regimes.
Integrating MAE Into Your Trading Workflow
Setting up automated MAE tracking eliminates the manual calculation burden and ensures no trade goes unanalyzed. PortQuant's Portfolio Engineering automatically calculates and stores MAE and MFE for every position, building a comprehensive database that reveals long-term patterns.
The Trade Excursion analysis in PortQuant displays an interactive MAE vs MFE scatter chart for each strategy — showing at a glance whether your entries are well-timed, whether your exits capture available profit, and which trade setups carry hidden risk. Combined with exit efficiency metrics and winner/loser breakdowns, this provides a complete picture of your strategy's true risk-reward profile.
Frequently Asked Questions
What is the difference between drawdown and Maximum Adverse Excursion?
Drawdown measures the decline in your overall account equity from its peak value, while MAE tracks the worst price movement against a single trade from its entry point. Drawdown is account-level; MAE is trade-level. A single large MAE trade might cause significant drawdown, but you can experience drawdown from multiple small losses without any individual trade having large MAE.
How can MAE improve my stop loss strategy?
MAE data shows you the typical adverse movement your winning trades survive before becoming profitable. By analyzing MAE distributions for winning versus losing trades, you can place stops beyond normal market noise but before the point where trades statistically become losers. This optimization reduces premature stop-outs while maintaining capital protection.
What MAE level is considered acceptable?
Acceptable MAE varies by strategy type and currency pair volatility. Scalping strategies typically show MAE under 0.5%, day trading strategies range from 0.5% to 2%, and swing trading strategies might see 2% to 5% MAE. Compare your MAE to your average profit per trade — if MAE consistently exceeds your average win, the risk-reward balance needs adjustment.
Can I track MAE on MT4 and MT5?
MT4 and MT5 do not provide native MAE tracking in standard reports. You can manually review charts to identify the worst price point during each trade, but this becomes impractical for analyzing hundreds of trades. PortQuant offers automated MAE and MFE tracking specifically designed for MetaTrader platforms, reconstructing minute-level equity paths from M1 candle data.
How does MAE analysis help with position sizing?
MAE analysis reveals the typical adverse movement your strategy experiences, allowing you to size positions so that expected MAE translates to acceptable account risk. If your strategy shows 2% average MAE and you want to risk 1% per trade, size positions so that a 2% price move equals 1% of account equity. This approach maintains consistent risk across varying market conditions.
Should I use MAE alone or combine it with other metrics?
MAE works best when combined with MFE, win rate, profit factor, and expectancy. MAE alone tells you about risk exposure but not profitability or consistency. Combining MAE with MFE shows both risk and opportunity capture through the exit efficiency ratio. Adding win rate and profit factor completes the picture, revealing whether your risk exposure generates adequate returns.