
Monte Carlo Simulation for Forex Risk Analysis
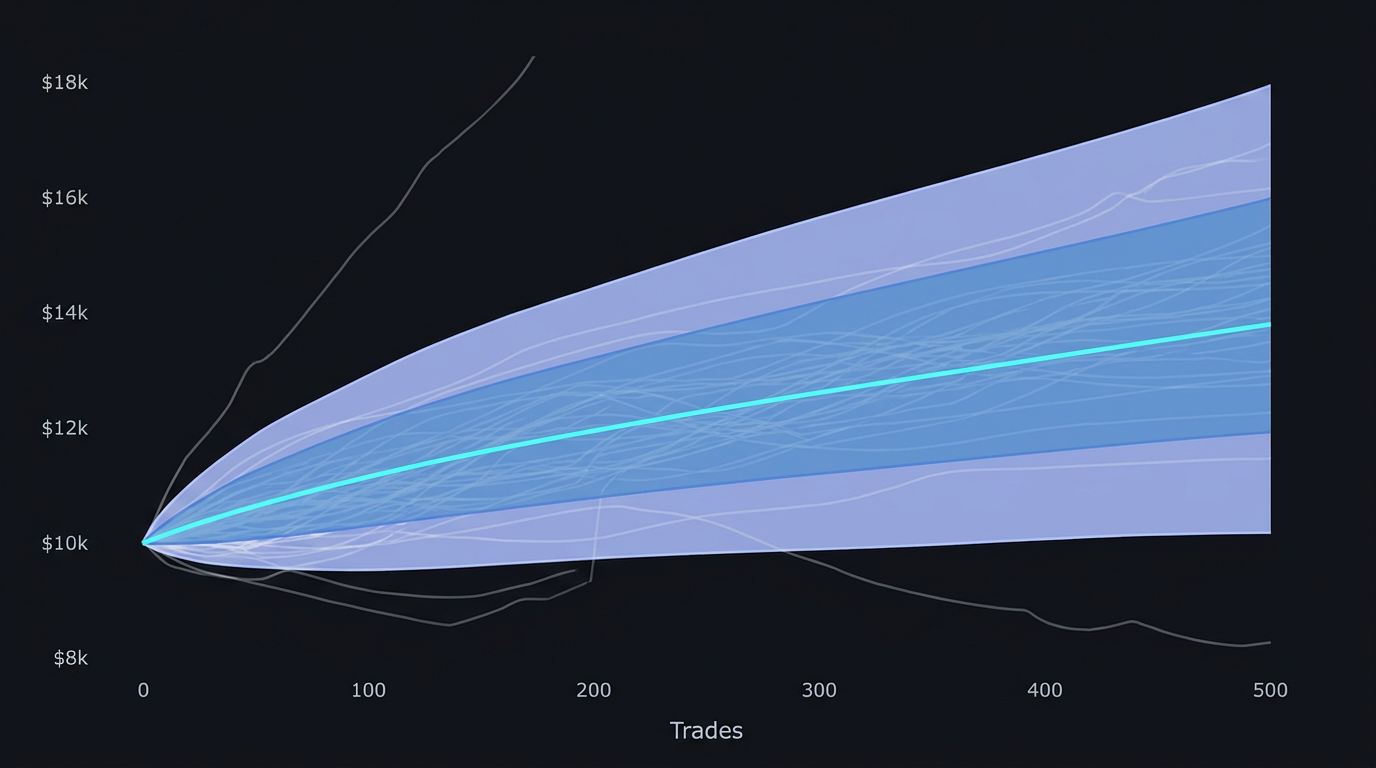
Monte Carlo simulation is the gold standard for understanding what your trading strategy might do next. Instead of relying on a single backtest that shows what happened, it runs thousands of possible scenarios — revealing the full range of what could happen.
But most Monte Carlo tools get it wrong. They simulate balance curves, ignore what happens during open trades, and break completely on grid and martingale strategies. PortQuant's Monte Carlo engine was built to fix exactly these problems.
What Is Monte Carlo Simulation in Trading?
Monte Carlo simulation is a statistical technique that uses random sampling to model thousands of potential outcomes. Named after the famous casino district, it takes your trading results and reshuffles the order of trades randomly across thousands of iterations.
Each simulation run represents a different possible sequence of trades you might experience. After thousands of runs, you get a probability distribution showing how often different results occur — revealing whether your strategy's historical performance was typical or just lucky timing.
This matters because markets don't repeat the exact same sequence twice. Two traders using identical strategies can experience vastly different results based solely on trade order. Monte Carlo shows you the full spectrum, helping you prepare for outcomes that haven't happened yet but statistically could.
Why Traditional Backtesting Falls Short
Traditional backtesting shows you one path through history. It assumes the specific sequence of trades that occurred represents what you'll experience going forward. In reality, even with the same win rate and risk-reward ratio, different trade sequences produce dramatically different equity curves.
The problem compounds when traders optimise based on historical results. You adjust parameters to maximise past performance, but you're fitting your strategy to one specific market path. When live conditions present trades in a different sequence, the optimised strategy often underperforms.
A strategy that showed a 15% maximum drawdown in backtesting might experience 30% or more with an equally probable but different trade sequence. Without Monte Carlo analysis, you'd never know that risk existed.
How Standard Monte Carlo Works
The most common Monte Carlo approach is straightforward: take your strategy's key statistics — win rate, average winning trade, average losing trade — and generate thousands of random trade sequences using those parameters. Each sequence maintains your strategy's statistical profile but arranges wins and losses in different orders.
For example, if your strategy has a 55% win rate with an average win of $150 and average loss of $100, the simulation creates thousands of different orderings. Some cluster wins early, others scatter them evenly, some place multiple losses consecutively.
After all runs complete, you get percentile bands showing the range of outcomes. The 50th percentile is the median, the 5th percentile shows near worst-case scenarios, and the 95th shows optimistic outcomes.
This is a significant improvement over single-path backtesting. But standard Monte Carlo has blind spots that give traders a false sense of security — and this is where PortQuant takes a fundamentally different approach.
Where Standard Monte Carlo Falls Short
It Only Sees Balance, Not Equity
Standard Monte Carlo simulates what your balance looks like after each trade closes. It completely ignores what happens during open trades.
A trade that dips -$500 before closing at +$200 looks identical to one that never went underwater. But the first trade exposed your account to far more risk. If you had three such trades open simultaneously, your account was temporarily down $1,500 — a drawdown that balance-only simulation never captures.
This is the difference between balance drawdown and equity drawdown. Your balance curve shows the staircase of closed trades. Your equity curve shows the real-time value including open positions. For risk management, equity drawdown is what actually matters — it's what triggers margin calls, violates funded account rules, and causes traders to panic-close positions.
It Assumes Every Trade Is Independent
Standard Monte Carlo treats each trade as a standalone event. This works for strategies that take one position at a time — a clean entry, exit, then next trade.
But many strategies hold multiple positions simultaneously. Grid systems, martingale approaches, and any strategy that scales into positions will have periods where several trades are open at once. Their floating P&L compounds. Their adverse excursions overlap.
A grid strategy might show 50 individual trades with modest drawdown each. But those trades were open in groups of 5-10 at a time, and during the worst moment all of them were underwater simultaneously. Standard Monte Carlo scatters those trades randomly across the simulation, destroying the relationship between them. The result: dramatically underestimated drawdown risk for the most common strategy type in forex.
It Simplifies Your Data
Parametric Monte Carlo — the most common type — reduces your entire trading history to a handful of numbers: win rate, average win, average loss, maybe standard deviation. Then it generates synthetic trades from those parameters.
This strips away the real shape of your results. Fat-tailed losing trades get averaged into modest numbers. Bimodal win distributions get collapsed into a single mean. The simulation runs on a fiction that resembles your strategy's statistics but not its actual behaviour.
How PortQuant Does Monte Carlo Differently
We built PortQuant's Monte Carlo engine from scratch because the standard approach was giving traders dangerously incomplete pictures of their risk. Here's what we do differently — and why it matters.
We Use Your Actual Trades, Not Statistics
PortQuant doesn't reduce your history to averages. Every simulated trade is an actual trade that happened in your account — drawn directly from your real results. This preserves the full distribution shape: the outliers, the skew, the fat tails, and the clustering that parametric models smooth away.
If your worst trade lost 5x more than your average loss, that trade stays in the simulation pool at its real magnitude. If your wins are bimodal (many small wins and a few big ones), both clusters appear in simulation. Your Monte Carlo results reflect your strategy's actual behaviour, not a simplified version of it.
We Simulate Equity, Not Just Balance
This is the biggest difference. PortQuant reconstructs minute-level equity data for every trade using your actual account history. When a trade is drawn into a Monte Carlo simulation, we don't just use its final P&L — we model the adverse excursion it experienced during its lifetime.
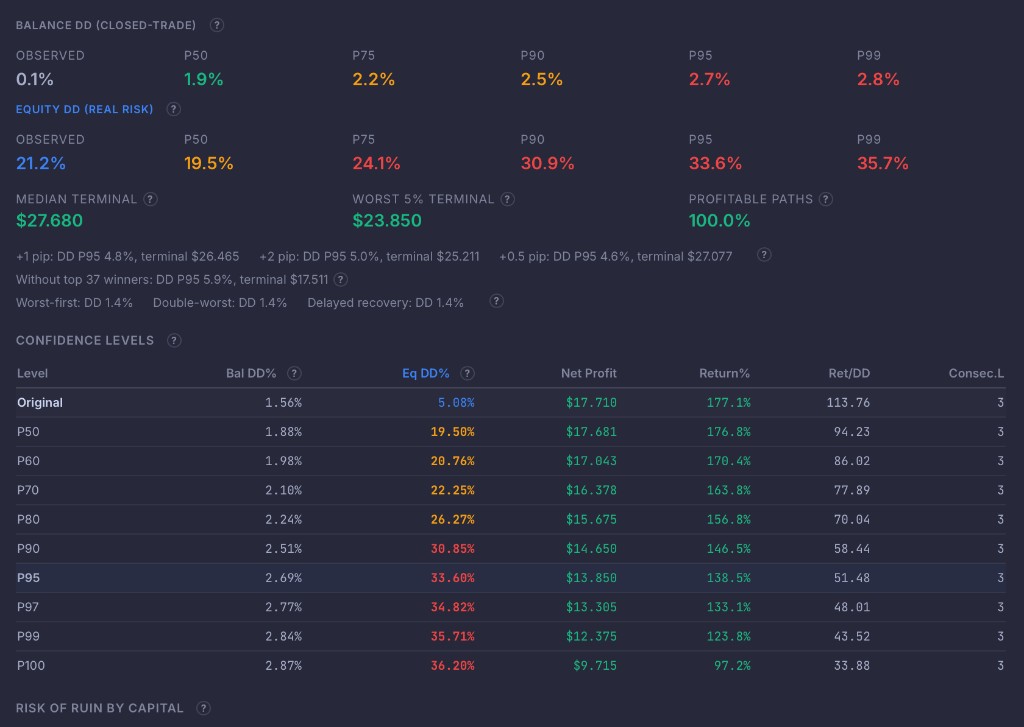
The result is two simultaneous views: a balance path showing closed-trade results, and an equity path showing real-time risk exposure including floating losses. The gap between these two paths is the hidden risk that every other Monte Carlo tool misses.
We Handle Grid and Martingale Strategies Properly
This is where PortQuant's Monte Carlo is genuinely unique. Standard Monte Carlo fundamentally cannot handle grid strategies — it treats each trade independently, which makes grid simulation results worthless.
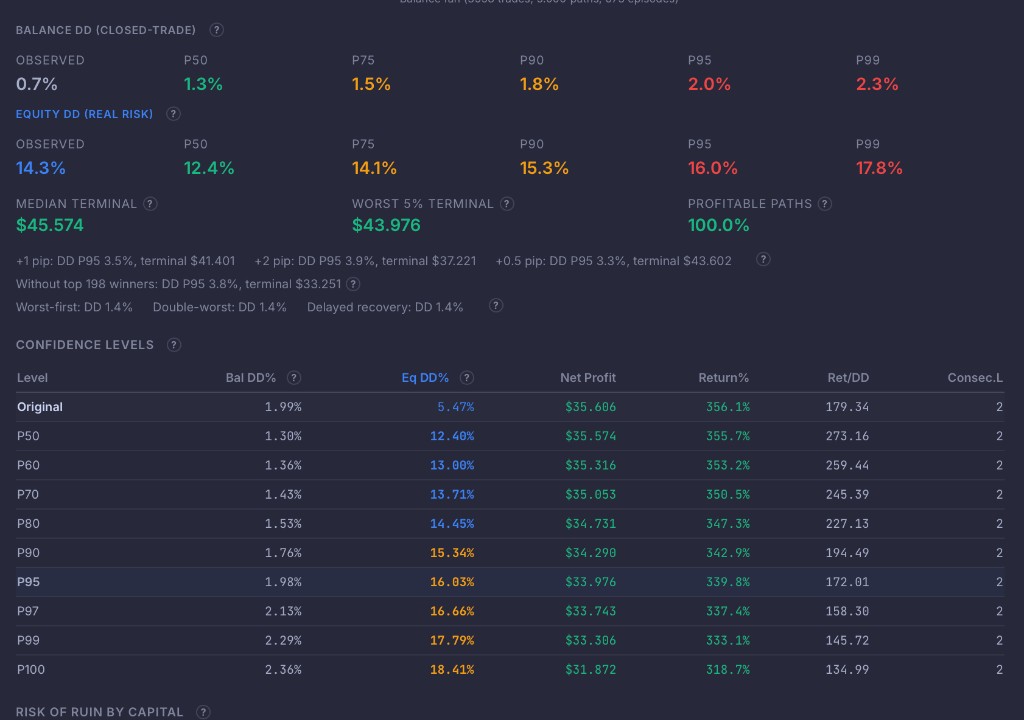
PortQuant automatically detects when trades overlap in time and groups them into episodes. A grid cycle with 8 overlapping legs becomes a single simulation unit. When that episode is drawn during Monte Carlo, all 8 trades come together — preserving the combined adverse excursion, the correlated floating drawdowns, and the actual risk profile of the grid cycle.
Without episode-based simulation, a grid strategy's Monte Carlo results might show a P95 drawdown of 12%. With episode awareness, the real P95 might be 35%. That's not a rounding error — it's the difference between a funded account that survives and one that blows a drawdown limit.
We Stress Test Beyond Random Shuffling
Standard Monte Carlo only answers one question: "what if my trades happened in a different random order?" PortQuant goes further with targeted stress tests:
- Worst-case sequencing: What if your worst trading period happens first, before the account has built any profit cushion?
- Cost sensitivity: How do results change if spreads widen or commissions increase?
- Tail removal: What if your best trades were lucky outliers that never repeat?
These scenarios test specific vulnerabilities that random shuffling alone might never surface.
Standard Monte Carlo vs PortQuant Monte Carlo
| Standard Monte Carlo | PortQuant Monte Carlo | |
|---|---|---|
| Input data | Win rate, avg win, avg loss | Your actual trade results |
| Distribution | Assumes normal distribution | Preserves real skew and outliers |
| What it simulates | Balance after each trade closes | Balance and equity during open trades |
| Drawdown | Peak-to-trough on closed P&L | Includes floating drawdown during open positions |
| Grid / martingale | Treats each trade independently | Groups overlapping positions into episodes |
| Stress testing | Typically not included | Worst-case sequencing, cost sensitivity, tail removal |
| Output | Single percentile band | Balance vs Equity fan charts with toggle |
Reading PortQuant's Monte Carlo Results
The Fan Chart
PortQuant's Monte Carlo output is visualised as a fan chart — shaded percentile bands showing the range of outcomes across all simulation paths.
- P50 (median): The middle outcome. Half of simulations do better, half worse. This is your realistic expectation.
- P25–P75 band: The "likely" range. About half of all outcomes fall here.
- P5–P95 band: The "plausible" range. Only 5% of outcomes are worse than P5.
- P5 line: Your planning worst case. If your account can survive P5, it can survive 95% of possible trade sequences.
The gap between P5 and P95 tells you how sensitive your strategy is to trade order. Narrow band = consistent results regardless of sequence. Wide band = luck plays a significant role.
The Balance vs Equity Toggle
PortQuant lets you switch between balance and equity views of your Monte Carlo results. Compare them:
- Balance DD P95: 18% — worst-case drawdown from closed trades only
- Equity DD P95: 29% — worst-case drawdown including floating losses
That 11-point gap is real risk that balance-only tools miss entirely. It's the drawdown your broker reports, that triggers margin warnings, and that you actually live through. PortQuant shows you both so you can make decisions based on the number that matters.
Drawdown Probability
Instead of asking "what was my maximum drawdown," PortQuant's Monte Carlo lets you ask "what's the probability I'll experience a 30% drawdown?"
If simulations show a 10% chance of 30% drawdown, you decide whether that's acceptable. Trading a funded account with a 5% daily loss limit? You need the P95 equity drawdown — not just the P95 balance drawdown — to stay well below that threshold.
Practical Applications in PortQuant
Strategy Qualification
Before deploying a strategy live, run Monte Carlo in PortQuant's Portfolio Engineering to determine if it's genuinely robust or historically lucky. A robust strategy shows consistent results across most simulation runs, with the P25 outcome still profitable. A fragile strategy shows excellent median results but wide variance — the kind that blows up in live trading.
Position Sizing
Run simulations with different position sizes to see how each affects your drawdown probability distribution. Reducing risk per trade from 2% to 1.5% might cut your P95 equity drawdown from 32% to 23% — a worthwhile trade-off that Monte Carlo makes visible and quantifiable.
Portfolio Allocation
When trading multiple strategies, PortQuant simulates their combined performance under different capital allocations. A volatile strategy paired with a stable one might produce better risk-adjusted returns at a 40/60 split than equal allocation. Simulation reveals the optimal balance without risking real capital.
Setting Realistic Expectations
If simulations show only a 40% chance of doubling your account in a year, that goal requires exceptional luck. If 80% of simulations achieve 20% annual returns, that becomes a realistic and defensible target. Monte Carlo replaces hope with probability.
Common Mistakes
Over-optimising based on simulation results defeats the purpose. Running simulations and then tweaking parameters to improve the output creates the same curve-fitting problem as traditional backtesting.
Insufficient trade history produces unreliable results. You need at least 100-200 trades for meaningful simulation. With only 30-50 trades, the input data might not represent your strategy's true characteristics.
Ignoring serial correlation. Basic Monte Carlo assumes each trade is independent. If your strategy catches trends, wins might cluster. Grid strategies have inherent position overlap. PortQuant's episode-based approach accounts for this — but be aware of the limitation if you're using tools that don't.
Never updating your models. Market volatility, spread costs, and strategy behaviour change over time. Recalibrate with recent data quarterly, or after significant market regime changes.
Frequently Asked Questions
How many simulations does PortQuant run?
PortQuant runs 5,000 simulation paths by default — enough for stable probability distributions where additional runs don't significantly change percentile outcomes. Below 1,000 runs, results become unstable.
Can Monte Carlo simulation predict future market movements?
No. Monte Carlo doesn't predict market direction. It models the range of possible outcomes based on your strategy's performance characteristics. It's about understanding risk distribution, not forecasting prices.
How does Monte Carlo differ from standard backtesting?
Backtesting replays your strategy through historical data to show what would have happened — one outcome. Monte Carlo takes your performance data and generates thousands of alternate scenarios by reshuffling trades. Backtesting shows what did happen; Monte Carlo shows the range of what could happen.
Is Monte Carlo suitable for grid and martingale strategies?
Standard Monte Carlo is poorly suited for grid strategies — it treats each trade independently, breaking the relationship between overlapping positions. This is one of the main reasons we built PortQuant's episode-based Monte Carlo. By grouping overlapping trades and simulating them as units, we produce realistic drawdown estimates for grid strategies instead of the dangerously underestimated numbers that standard tools output.
What's more important — balance drawdown or equity drawdown?
Equity drawdown, always. Balance drawdown only counts losses from closed trades. Equity drawdown includes the floating losses while positions are open — what your broker reports, what triggers margin calls, and what you actually live through. PortQuant shows both so you can see the gap and plan accordingly.
Can I combine Monte Carlo with other risk analysis?
Yes, and you should. Monte Carlo reveals outcome distributions and drawdown probabilities. Maximum Adverse Excursion (MAE) analysis shows per-trade risk behaviour. Each technique reveals different aspects of risk that together build a complete picture. PortQuant integrates both into its Portfolio Engineering workflow.