
Equity Drawdown vs Balance Drawdown: What MT4/MT5 Traders Miss
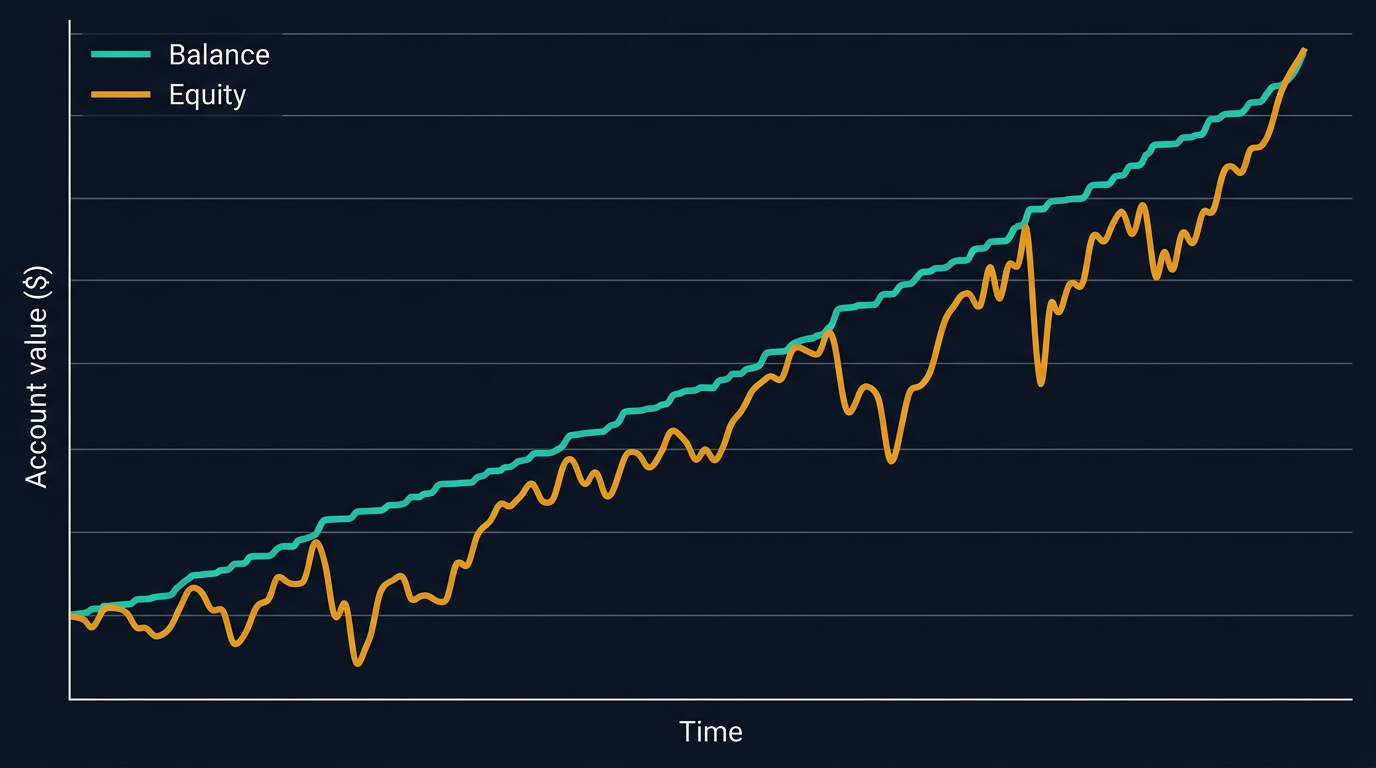
TL;DR. Balance drawdown only updates when a trade closes. Equity drawdown updates while trades are open and includes floating P&L. If you size positions from balance DD, you are sizing off a delayed, smoothed version of your real risk.
The two definitions
Balance drawdown is the peak-to-trough decline of your closed-trade equity. It only moves when a position is closed.
Equity drawdown is the peak-to-trough decline of your real-time equity, including floating P&L on open positions. It moves continuously while trades are open.
Both are measured against a running high-water mark — the highest value the curve has reached so far. Not the session start, not the trade entry, and it does not reset after a drawdown. Once the curve makes a new high, the high-water mark advances.
Balance vs Equity vs In-Trade DD
PortQuant tracks three drawdown metrics per account. They answer different questions:
| Metric | What it tracks | Updates on | Use for |
|---|---|---|---|
| Balance DD | Closed-trade equity vs HWM | Trade close | Realised performance reporting |
| Equity DD | Live equity (closed + floating) vs HWM | Every M1 candle during open trades | Position sizing, breach monitoring |
| In-Trade DD | Worst floating loss within a single trade | Per trade | Stop placement, MAE analysis |
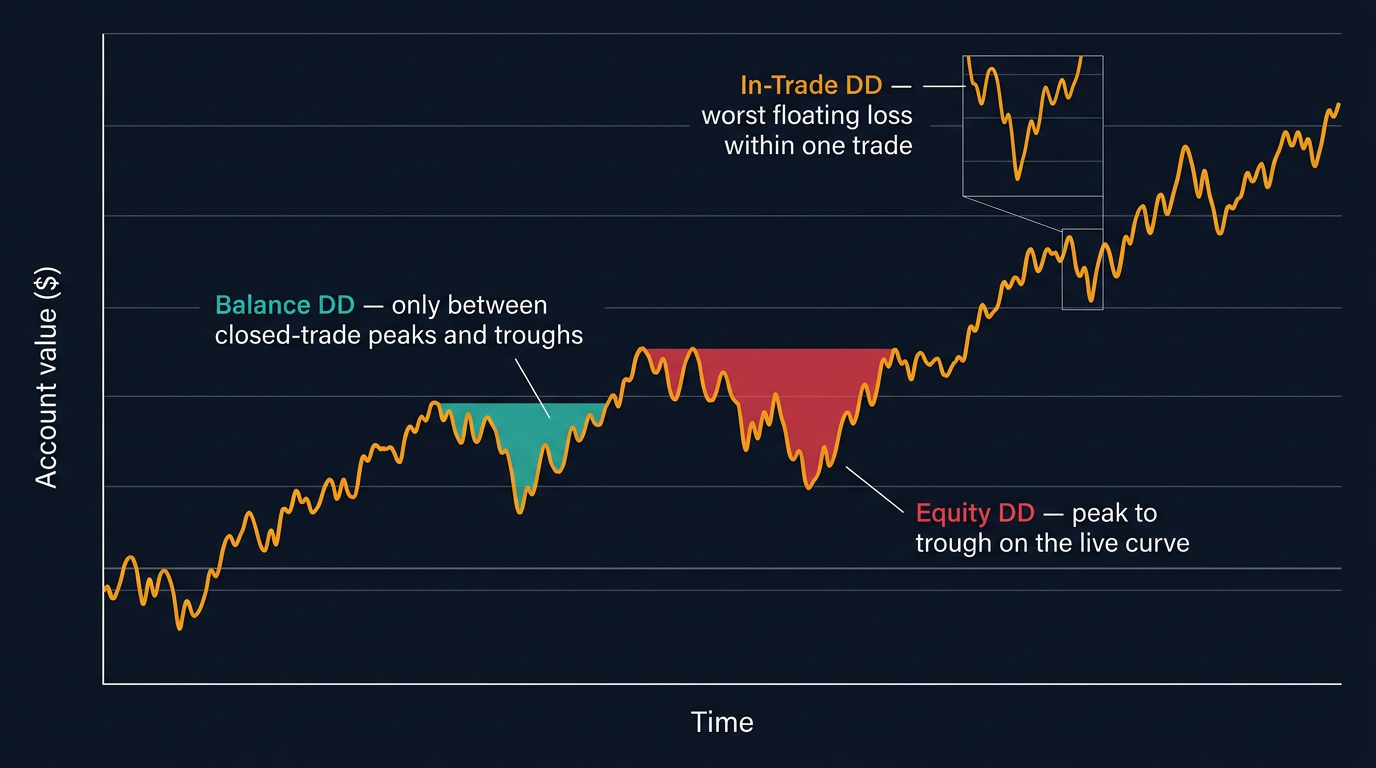
Balance DD is the most forgiving number. Equity DD is the one that correlates with account blow-ups, prop-firm breaches, and the emotional pressure that closes winners early.
Worked example
Long 1.00 lot EUR/USD at 1.1000 on a $10,000 account. The trade closes two hours later at 1.1020 — a +$200 winner.
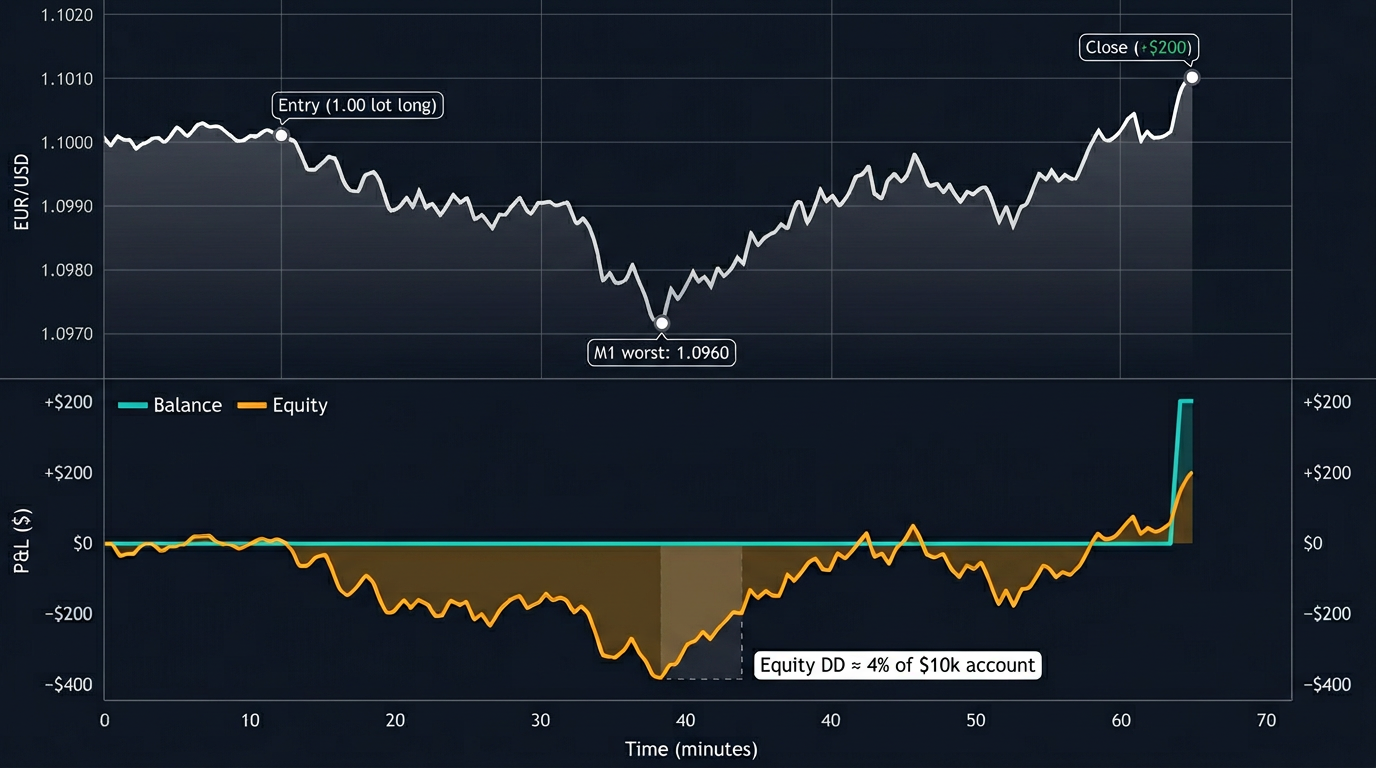
- Balance curve: flat during the trade, then steps up by $200 at close.
- Equity curve: during the trade, price dipped to 1.0960 on an M1 candle. At that minute, floating P&L was −$400 and equity was $400 below the prior HWM.
Balance DD for this trade: 0%. Equity DD for this trade: about 4%.
Same trade, same outcome, two very different risk numbers. Sizing the next position from balance DD ignores the −$400 excursion that actually happened.
Why most platforms show balance DD only
Balance DD is cheap to compute: one data point per closed deal. Historical equity DD is not, because MT4 and MT5 trade reports do not store intra-trade equity — only entry and exit.
To reconstruct an honest equity DD across closed trades, you need per-minute price data for every open position, then recompute floating P&L candle by candle. Live terminals approximate this with the current tick, but retrospective equity DD on closed trade history requires minute-level reconstruction.
How PortQuant computes equity drawdown
For every trade on a connected MT4 or MT5 account:
- The PortQuant Expert Advisor pulls M1 bars covering the full trade window.
- For each minute it computes the floating P&L and the minute's worst floating P&L:
floating_pnl = (price − entry_price) × volume × contract_size × tick_value
- Results are stored per-trade in a minute-level table (
trade_minute_equity, TimescaleDB hypertable). - The drawdown worker walks the full account timeline and derives three series against the peak equity high-water mark: Equity DD, Balance DD, In-Trade DD.
Two accuracy details that matter:
- Starting equity is derived from non-trading deals only (deposits, credits, rebates) — never from early trading P&L. This avoids the common funding bug where the first trade's outcome distorts every later DD reading.
- Realised close events include swap, commission, and fees, so the balance curve matches what the broker actually credited.
For the per-trade excursion view, see Maximum Adverse Excursion in Forex Trading. For forward-looking DD under resampled trade sequences, see Monte Carlo Simulation for Forex Risk Analysis.
Which metric for which decision
- Position sizing and risk limits → equity DD. This is the real exposure to the market.
- Performance reporting and realised returns → balance DD. This is what the broker settled.
- Stop placement and per-trade analysis → in-trade DD. This is the heat each setup takes.
Most strategies look better on balance and worse on equity. The gap between the two is the information.
Frequently Asked Questions
Is equity drawdown the same as floating drawdown?
They describe the same underlying idea — drawdown that includes unrealised P&L — but "floating drawdown" usually refers to the unrealised component alone, while equity drawdown is the full balance + floating view against the high-water mark.
How do I see equity drawdown on MT4 or MT5?
Your terminal shows live equity and live drawdown against current equity, but not a historical equity drawdown series across closed trades. That requires per-minute reconstruction for every trade, which PortQuant performs automatically for connected accounts.
Why is my balance drawdown smaller than my equity drawdown?
Because balance drawdown only records the final outcome of closed trades, while equity drawdown captures the worst point reached while trades were still open. The gap is largest for strategies that hold through adverse excursions — grid, martingale, wide stops, and multi-leg positions.
What drawdown do prop firms measure?
Most prop firms enforce equity-based rules — daily loss and max loss are both computed on equity, not balance. Monitoring balance drawdown while a prop firm monitors equity drawdown is the most common cause of silent breaches.
Is equity drawdown useful for scalpers?
Yes. Scalpers often hold several correlated positions simultaneously. Balance drawdown stays flat while those positions are open; equity drawdown is the only view that shows the combined floating exposure at any given minute.
How is the high-water mark defined?
It is the highest value the equity curve has reached up to that point — not the session start, not the trade entry, and not rebased after drawdowns. Once equity makes a new high, the high-water mark advances; it never resets backwards.